Data Visualization with R
Master the art of creating insightful, customizable data visualizations using R to uncover trends and patterns effectively.


10000+
Learners Enrolled
4.7+ (7800+ Ratings)

Description
Data visualization is the presentation of data with graphics. It’s a way to summarize your findings and display it in a form that facilitates interpretation and can help in identifying patterns or trends. In this course you will learn how to create beautiful graphics and charts, customizing the look and feel of them as you wish.
The main goal of this course is to teach you how to take data that at first glance has little meaning and present that data in a form that makes sense to people. Various techniques have been developed for presenting data visually but in this course, we will be using the open source language R.
Want to see what's inside the course?
Program Details & Benefits
- Learning Category : Self Paced Online Learning includes Videos, Lab/Assignments, Hands on Practice Test along with Doubt Clearance Session.
- Learning Hours : 60+ Hours.
- Language : English.
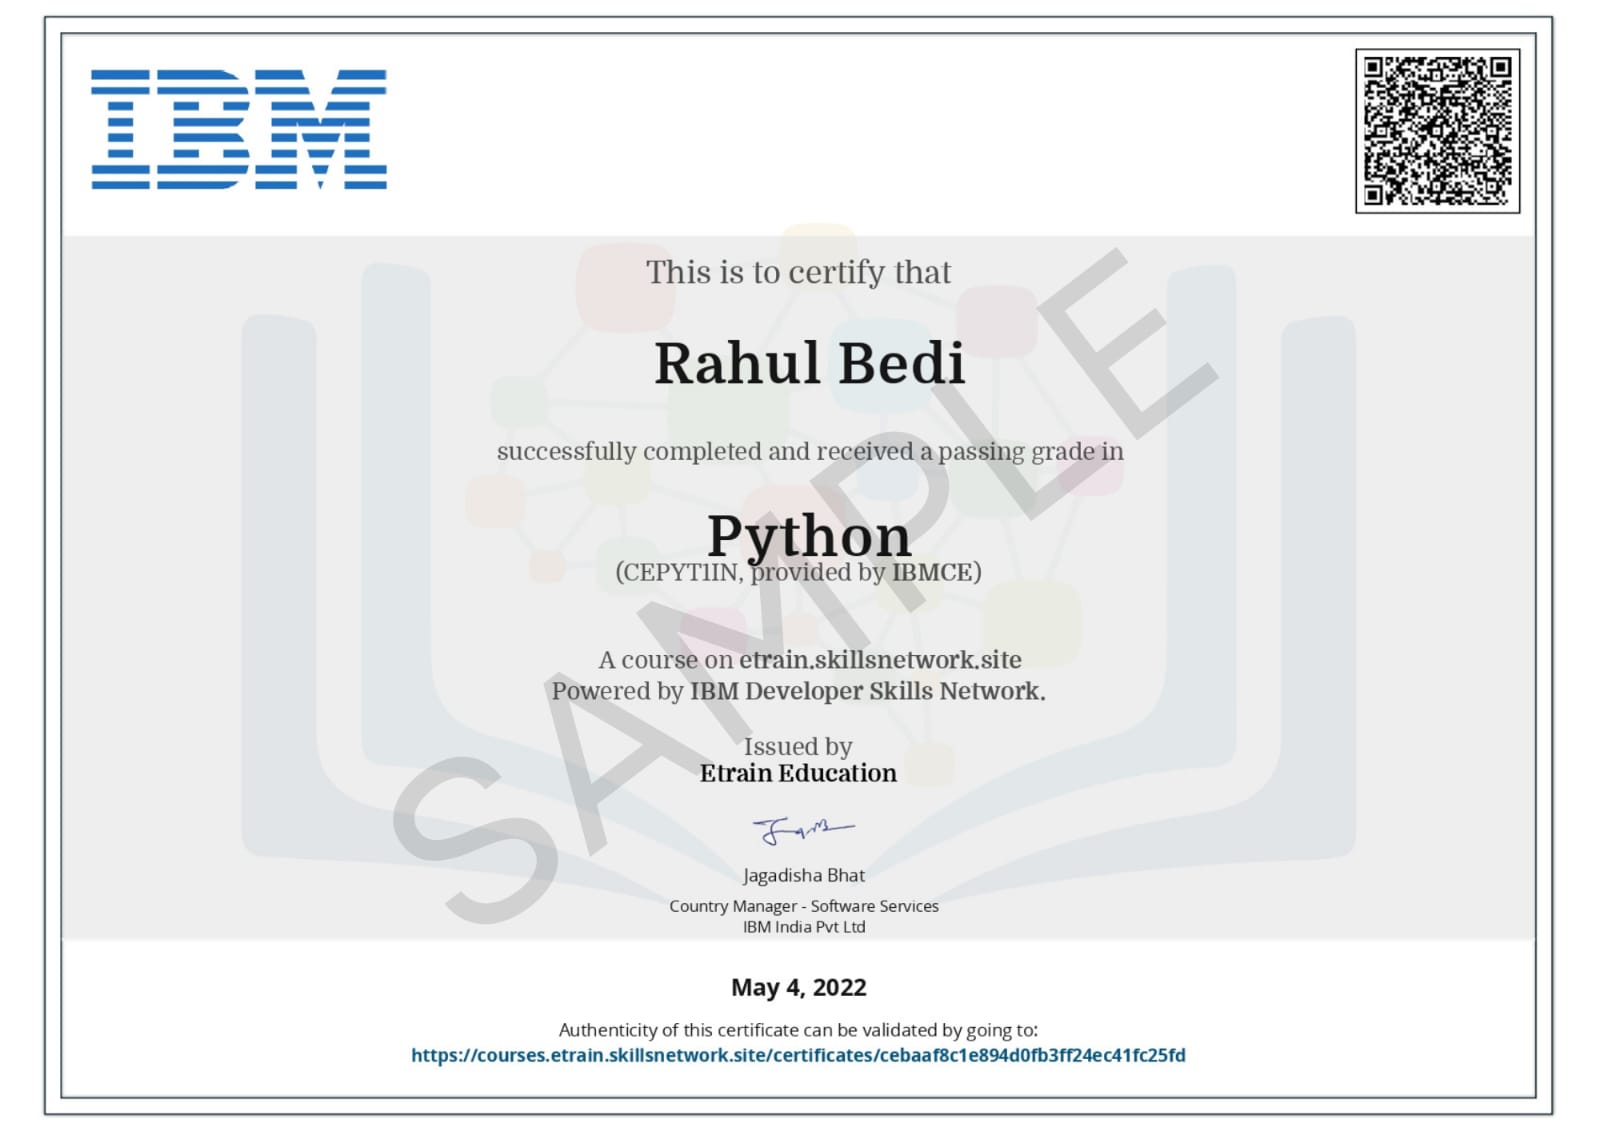
- Certification : Our Certifications Upon Successful Completion of Online Exams.
- Job : 100% Job Assistance.
Outcomes
- Industry-recognized certification for global job opportunities.
- Enhanced skills for career growth and advancement.
- In-demand expertise for roles in tech and business.
- Access to job placement support and career guidance.
- Preparation for freelancing or entrepreneurial ventures.
You may also like our Fast Track Career Programs

IBM - Big Data Analytics Professional Program
60+ Hours
4.9/5

IBM - Generative AI & ML Professional Program
60+ Hours
4.9/5

IBM - Industry 4.0 with Internet of Things (IoT) Professional Program
60+ Hours
4.9/5


